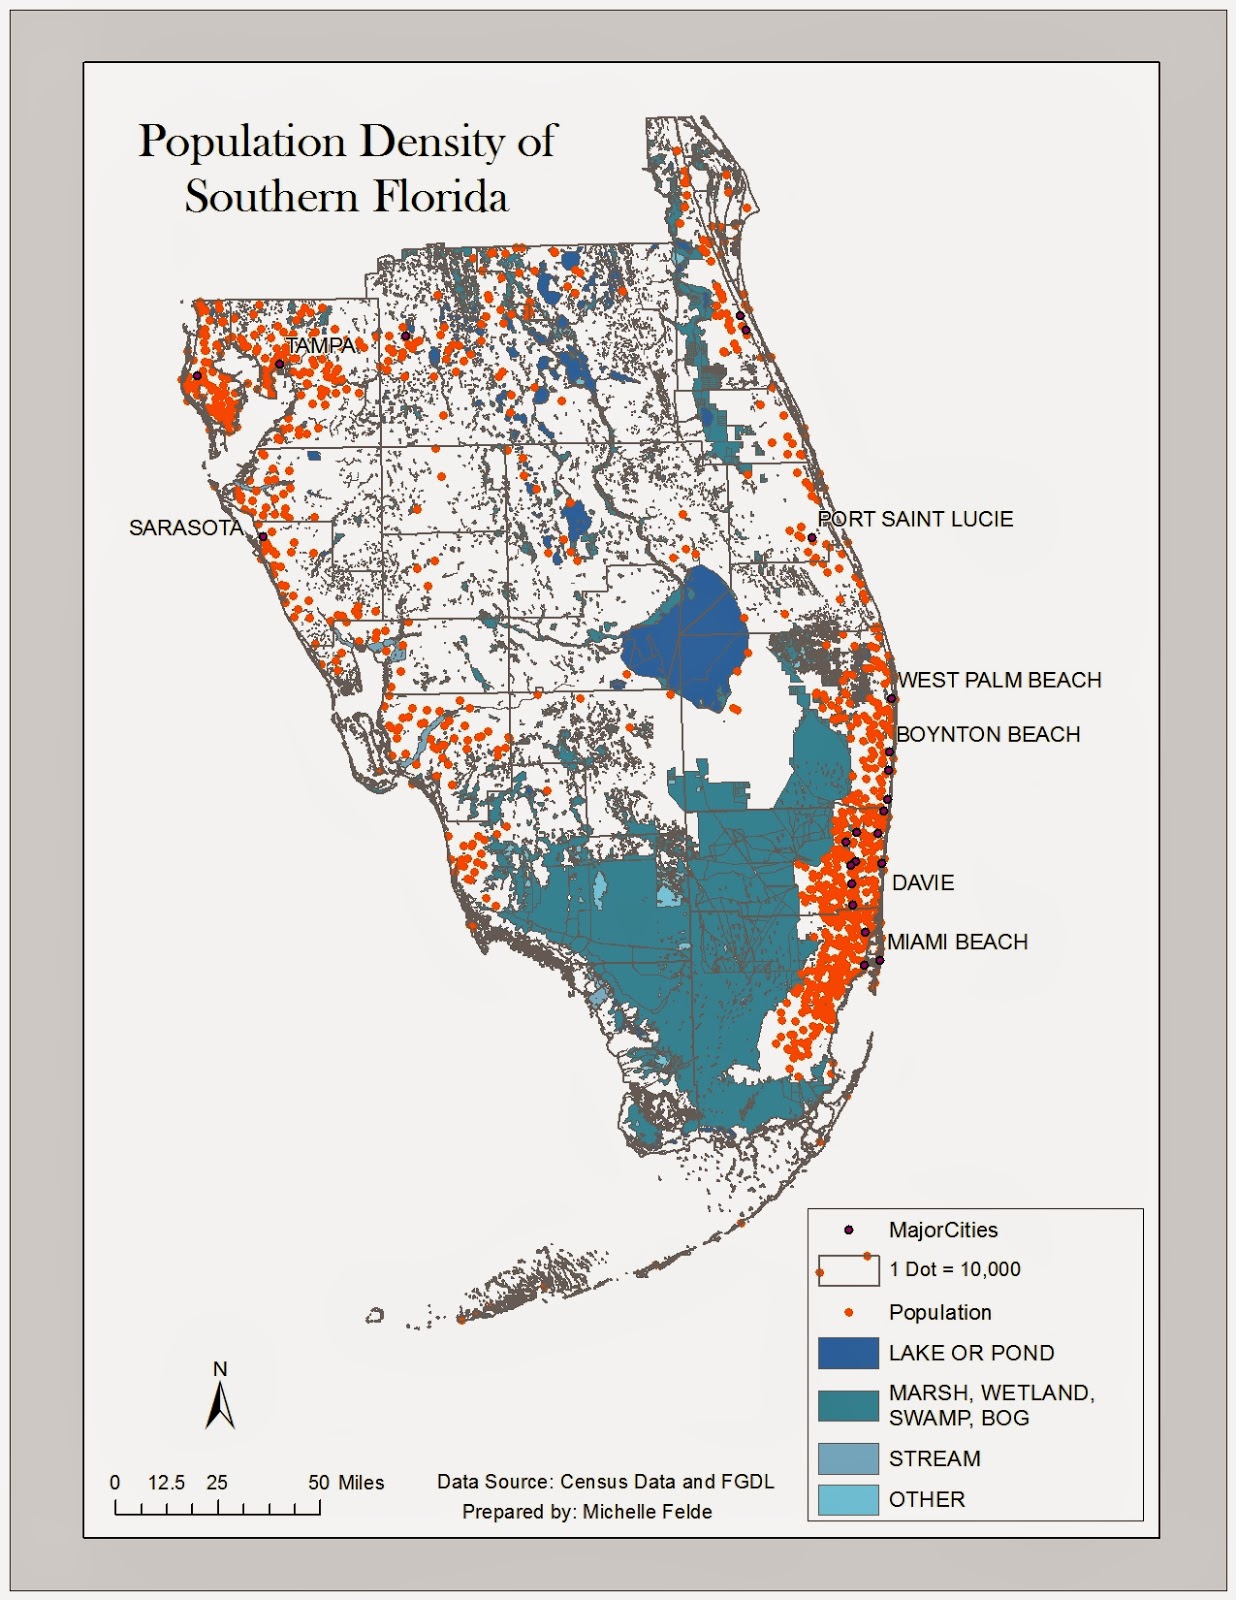
 Module 10's objectives were to join spatial and tabular data, and understand dot density symbols. Along with dot density, a goal was to learn how to use masking and good dot map practices.
The map I prepared shows the population density of Florida counties. To create this map I joined census data to the county shapefile. Then I used the Quantities and Dot Density under the Symbology tab. I selected the Population field to use to display the dots and adjusted the dot size.
To avoid dots being placed where people do not live such as rivers or lakes, I used the masking property. Here I can select what layer the dots should be placed or which layer to avoid. I selected to have dots placed in urban areas.
No comments:
Post a Comment