 Module 5 was about understanding spatial statistics and learning how to apply the tools in ArcMap. The tools helped find mean and median distribution of data. Also able to display the data through a histogram, QQ plot, and learn to find outliers with spatial statistic tools.
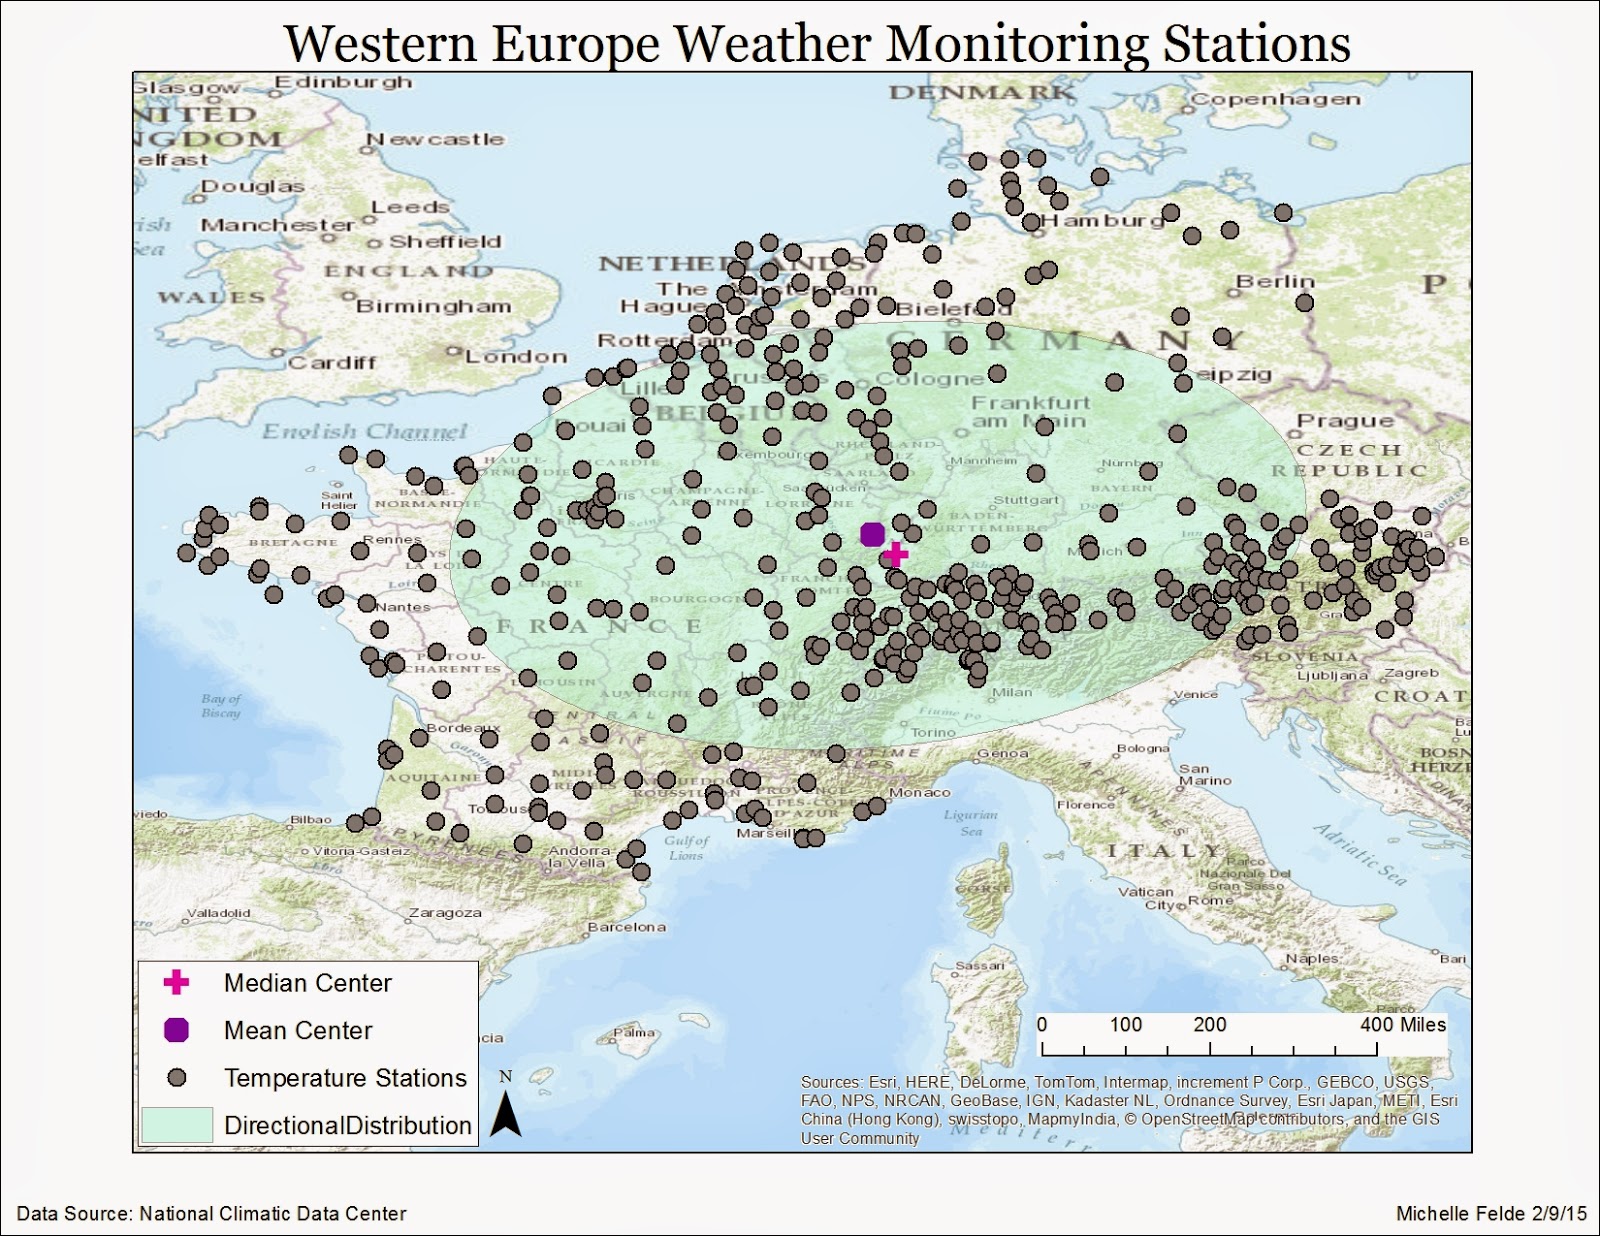
One of the exercises used the mean center tool to show the mean location of the data with a symbol. I then used the median center tool to display the median location of the data. This shows the clusters in certain countries have a greater affect on the median. To see the direction of the distribution used the spatial analysis toolbox. As you can see on the map, it is an east-west orientation. The large ellipsoid shows there is a large variation between the locations of the data.
It is important to understand how to use the data and what it is saying. Understanding statistics will help aid in the analysis of data.
No comments:
Post a Comment